A while back I reverse-engineered the Outback MATE protocol and made a Python library for emulating a MATE, and set it up collecting data from the family Holiday House (which is lucky enough to have an internet connection!). For a while I didn’t do anything more, and just left it collecting data, until I recently stumbled upon a nice open-source project called Grafana .
Grafana is a webserver written in Go which provides a beautiful UI for presenting and exploring time-series data. It seemed a natural fit to the solar charger data I had been collecting!
Here’s a screenshot of the system in action: (I haven’t made the dashboard available publically because of performance issues)
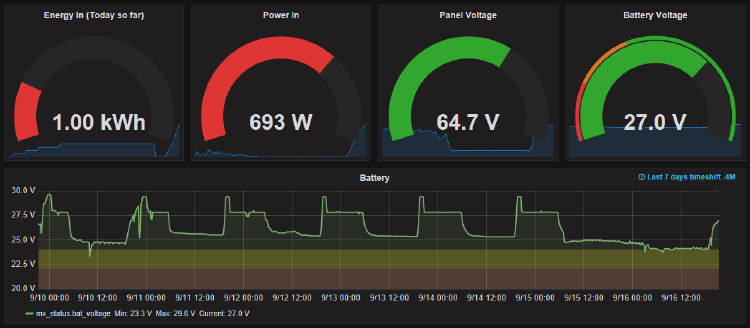
Now the effort of reverse-engineering the Outback protocol has finally paid off!
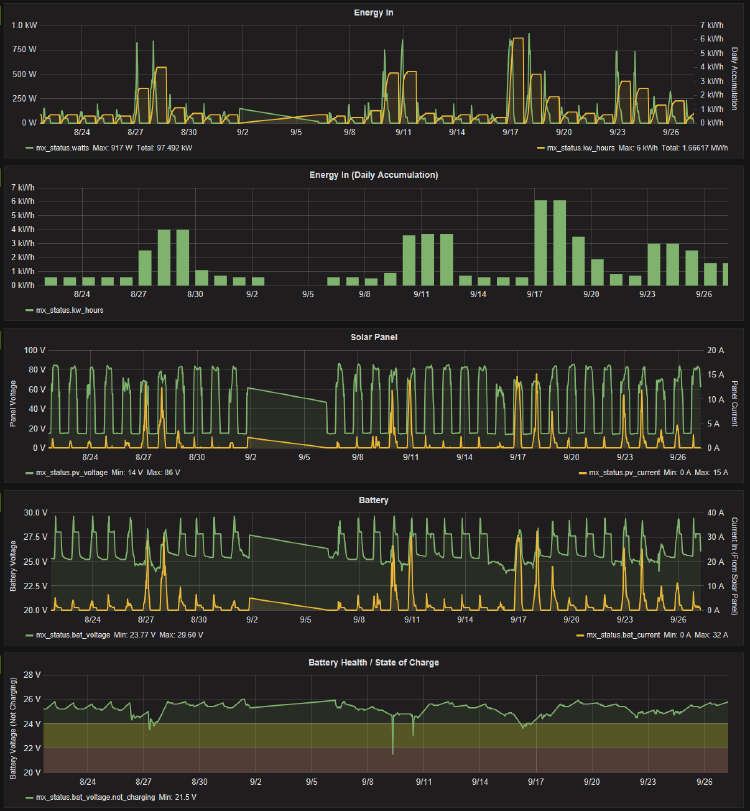
Look at all the insights we have into the system! You can see how much energy went into the system each day, how long the batteries keep their charge, how much the batteries have been drained (we rent the holiday house out to the public so this is a big concern), and lots of other useful info!
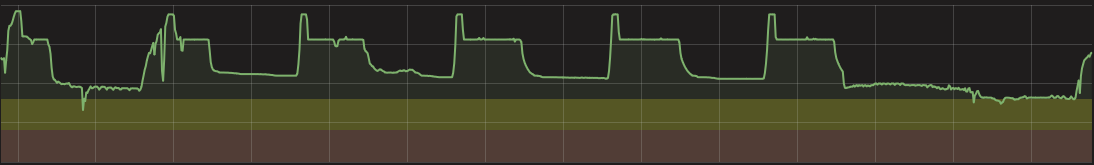
You can even drill right down and see the Outback MX 60/80’s charging algorithm:
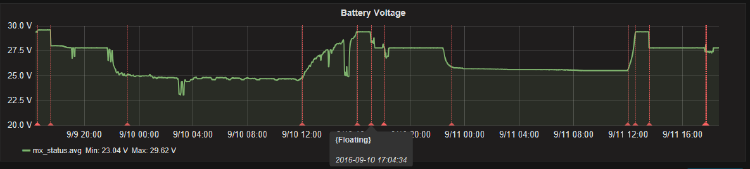
Pretty cool huh?
The Set-up
 Not getting any solar power today!
The holiday house is located in the remote New Zealand alps, far away from power and civilisation, though we are lucky to have an always-on WiFi internet connection. It is equipped with a bank of Solar panels and a bank of 24V lead-acid batteries, regulated by an Outback FLEXMax 60/80 charge controller. (It also has a wind turbine attached for charging, but this isn’t monitored)
Hardware
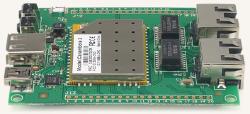
At the house, I set up a low-power MIPS linux board (The Carambola2 ), connected to the MX charger through a USB<>TTL serial adapter and my opto-isolator circuit. The board is powered directly from the 24V battery bank (through a buck regulator) so it can stay on 24/7.
The reason I chose this as opposed to a Raspberry Pi is because it is actually a router and WiFi access point, while also providing GPIOs and UART for monitoring the house. It’s not as powerful as a RPi (it uses a MIPS core rather than the more common ARM), but it’s powerful enough for some basic data collection!
Collection
I haven’t really put in a solid system for data collection yet.
It consists of some pretty basic Python scripts, one at the holiday house which collects the data using my pyMATE library and uploads it to a server, and the other sits on the server collecting data and stores it into a Postgres database.
I plan on improving this in the future to make it more reliable and use less internet data, once I find a suitable open-source project (or I might end up making my own!)
Grafana
It’s refreshing to finally see an application not written in Node.JS (I totally don’t have anything against Node.JS *cough*). Being written in Go it is fast and snappy, and light on resources! I keep it running in a cheap Linux virtual machine hosted on Azure, along with the Postgres database.
Unfortunately by default Grafana only supports time-series databases (TSDBs), not regular SQL databases like Postgres, which is where all my data is. I found someone’s Github fork which adds SQL support, and through that was able to connect my Postgres DB with very little effort.
I’ll probably consider moving to a TSDB in the future though, because querying Postgres isn’t particularly fast.
Comments
Note: Comments have been migrated from Disqus to Remark42, a privacy-preserving comment system. (why?)
You can comment anonymously or log in via Github or Email.